Find yourself overwhelmed with reporting options in Google Analytics? Not sure where to start your analysis on a regular basis? It does, after all, contain nearly everything and the kitchen sink.
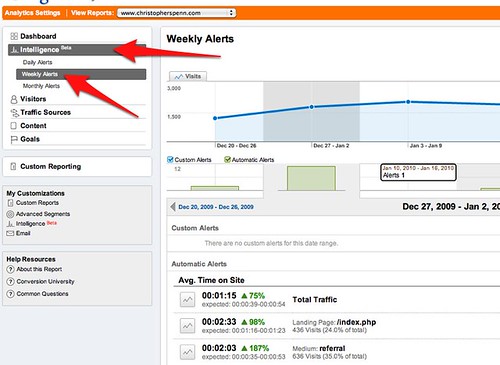
Here’s an easy way to get started and a great feature to show to your team. It’s Intelligence (beta). Go to your Google Analytics, click Intelligence, and select Weekly Reports. (daily’s not necessarily all that helpful)
Now you can see major changes in your analytics data from one screen, like a “what’s new” for your data. In the example below, I can see that referrals to this site were up, as were new visitors. That tells me that folks are coming here from links on other sites. If you look on the right hand side, Google even ranks the different pieces of information by what it thinks are events of greater or lesser significance.
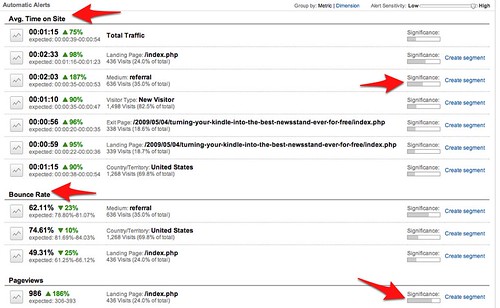
Click the Group by switch to change from metric to dimension – this is more or less like a simple PivotTable for the intelligence. Now, I can see that my referrals, which were up in the previous statistics, had some interesting behaviors. Their bounce rate was lower and their time on site was higher. This tells me that whatever they were coming to this site for, they found it (bounce rate dropped) and it was compelling enough that they stuck around (time on site).
Armed with this information, I can take a look at the content I created that week and any links I might have shared on Twitter, Facebook, or other places I share.
The Intelligence feature isn’t a replacement for hardcore analytics analysis by any means, but it’s a great way to start your day if you manage a web site. Intelligence will give you some initial areas to start digging into, some things to investigate as you prepare for your day.
Try it out!
Did you enjoy this blog post? If so, please subscribe right now!
Enjoyed it? Please share it!
Get this and other great articles from the source at www.ChristopherSPenn.com


Leave a Reply